Illustrations for publications, reviews, press release….
Figures and scientific illustrations are essential to summarize, simplify and/or explain complex scientific data or interdisciplinary collaborations. Translating scientific data into meaningful, visually appealing artwork increases exposure to the scientific and general public.
Beyond that, graphical representations can also help push science forward, always questioning scientific research in new innovative ways.

Composite Biosynthetic Graft for Repair of Long-Segment Tracheal Stenosis: A Pilot In Vivo and In Vitro Feasibility Study. Karkhanis, Byju, Morales, Zafar, Haridas. ASAIO Journal, ():10.1097, 2024.
[Published figure has been labeled by the authors]

Re-administration of AAV vectors by masking with host albumin: A Goldilocks hypothesis. J. Fraser Wright, Molecular Therapy (Vol. 31 No 7), 2023

Targeting PTEN but not SOCS3 resists an age-dependent decline in promoting axon sprouting. Geoffroy et al.,iScience, 25, 105383, 2022.
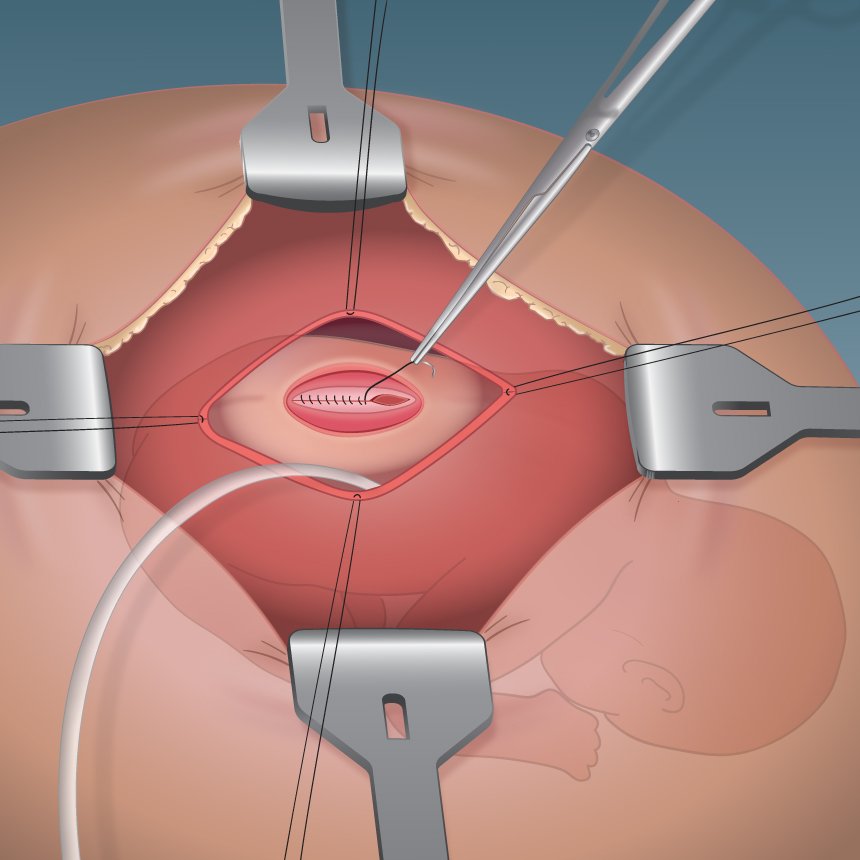
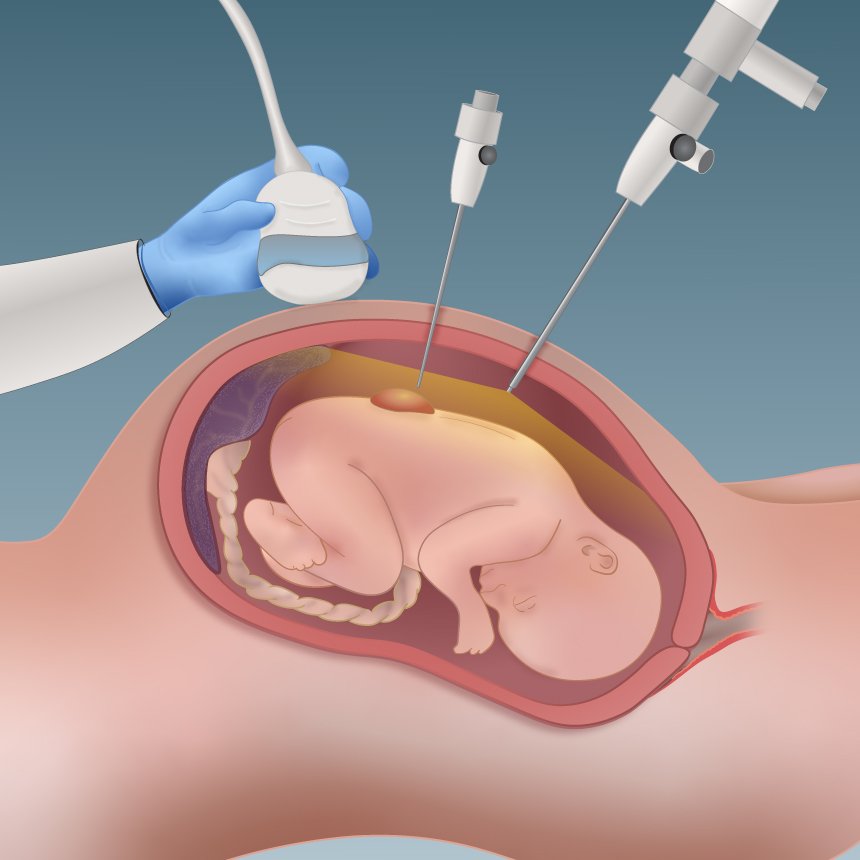
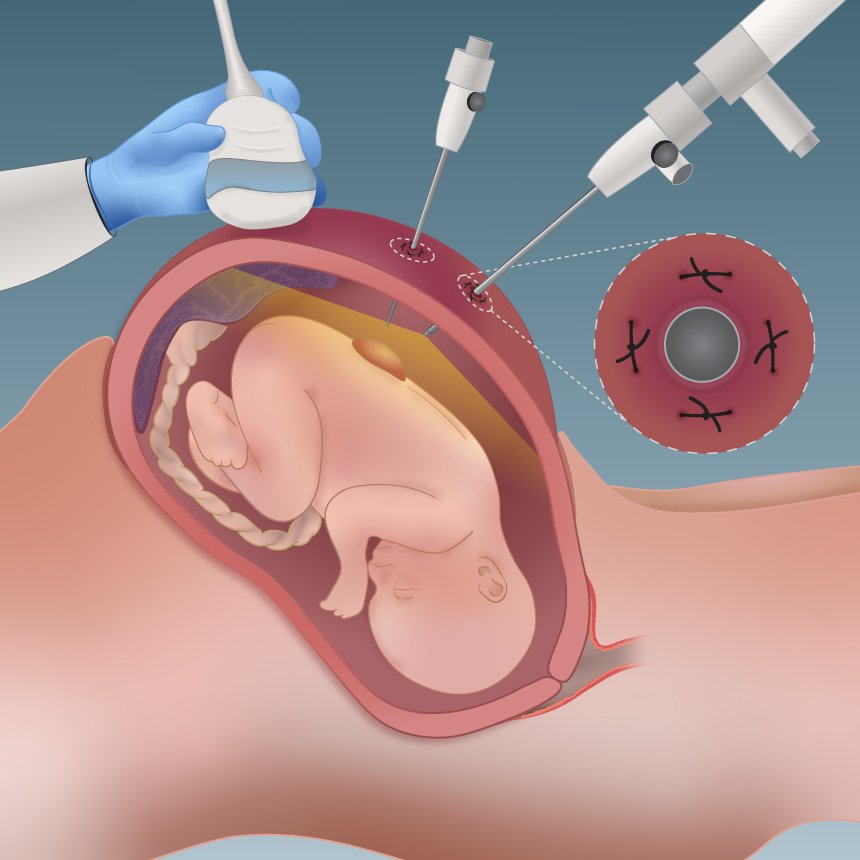
The ChorioAnchor: Design and Testing of a Novel Chorioamniotic Anchoring Device to Enable Percutaneous Fetoscopic Surgery. Byju A, G, et al., Fetal Diagn Ther, 2022.

Novel adult cortical neuron processing and screening method illustrates sex- and age-dependent effects of pharmaceutical compounds. Sefiani, A. et al., Sci Rep 12, 13125 (2022)

Evaluation of the Cardiometabolic Disorders after Spinal Cord Injury in Mice. Ghnenis, A.B. et al., Biology 2022, 11, 495.


The Potential Role of Inflammation in Modulating Endogenous Hippocampal Neurogenesis After SCI. Sefiani A. et al., Front. Neurosci., 2021 (vol.15)

Are mitochondria the key to reduce the age-dependent decline in axon growth after spinal cord injury? T. Sutherland et al., Neural Regen Res., 2021 Jul; 16(7): 1444–1445
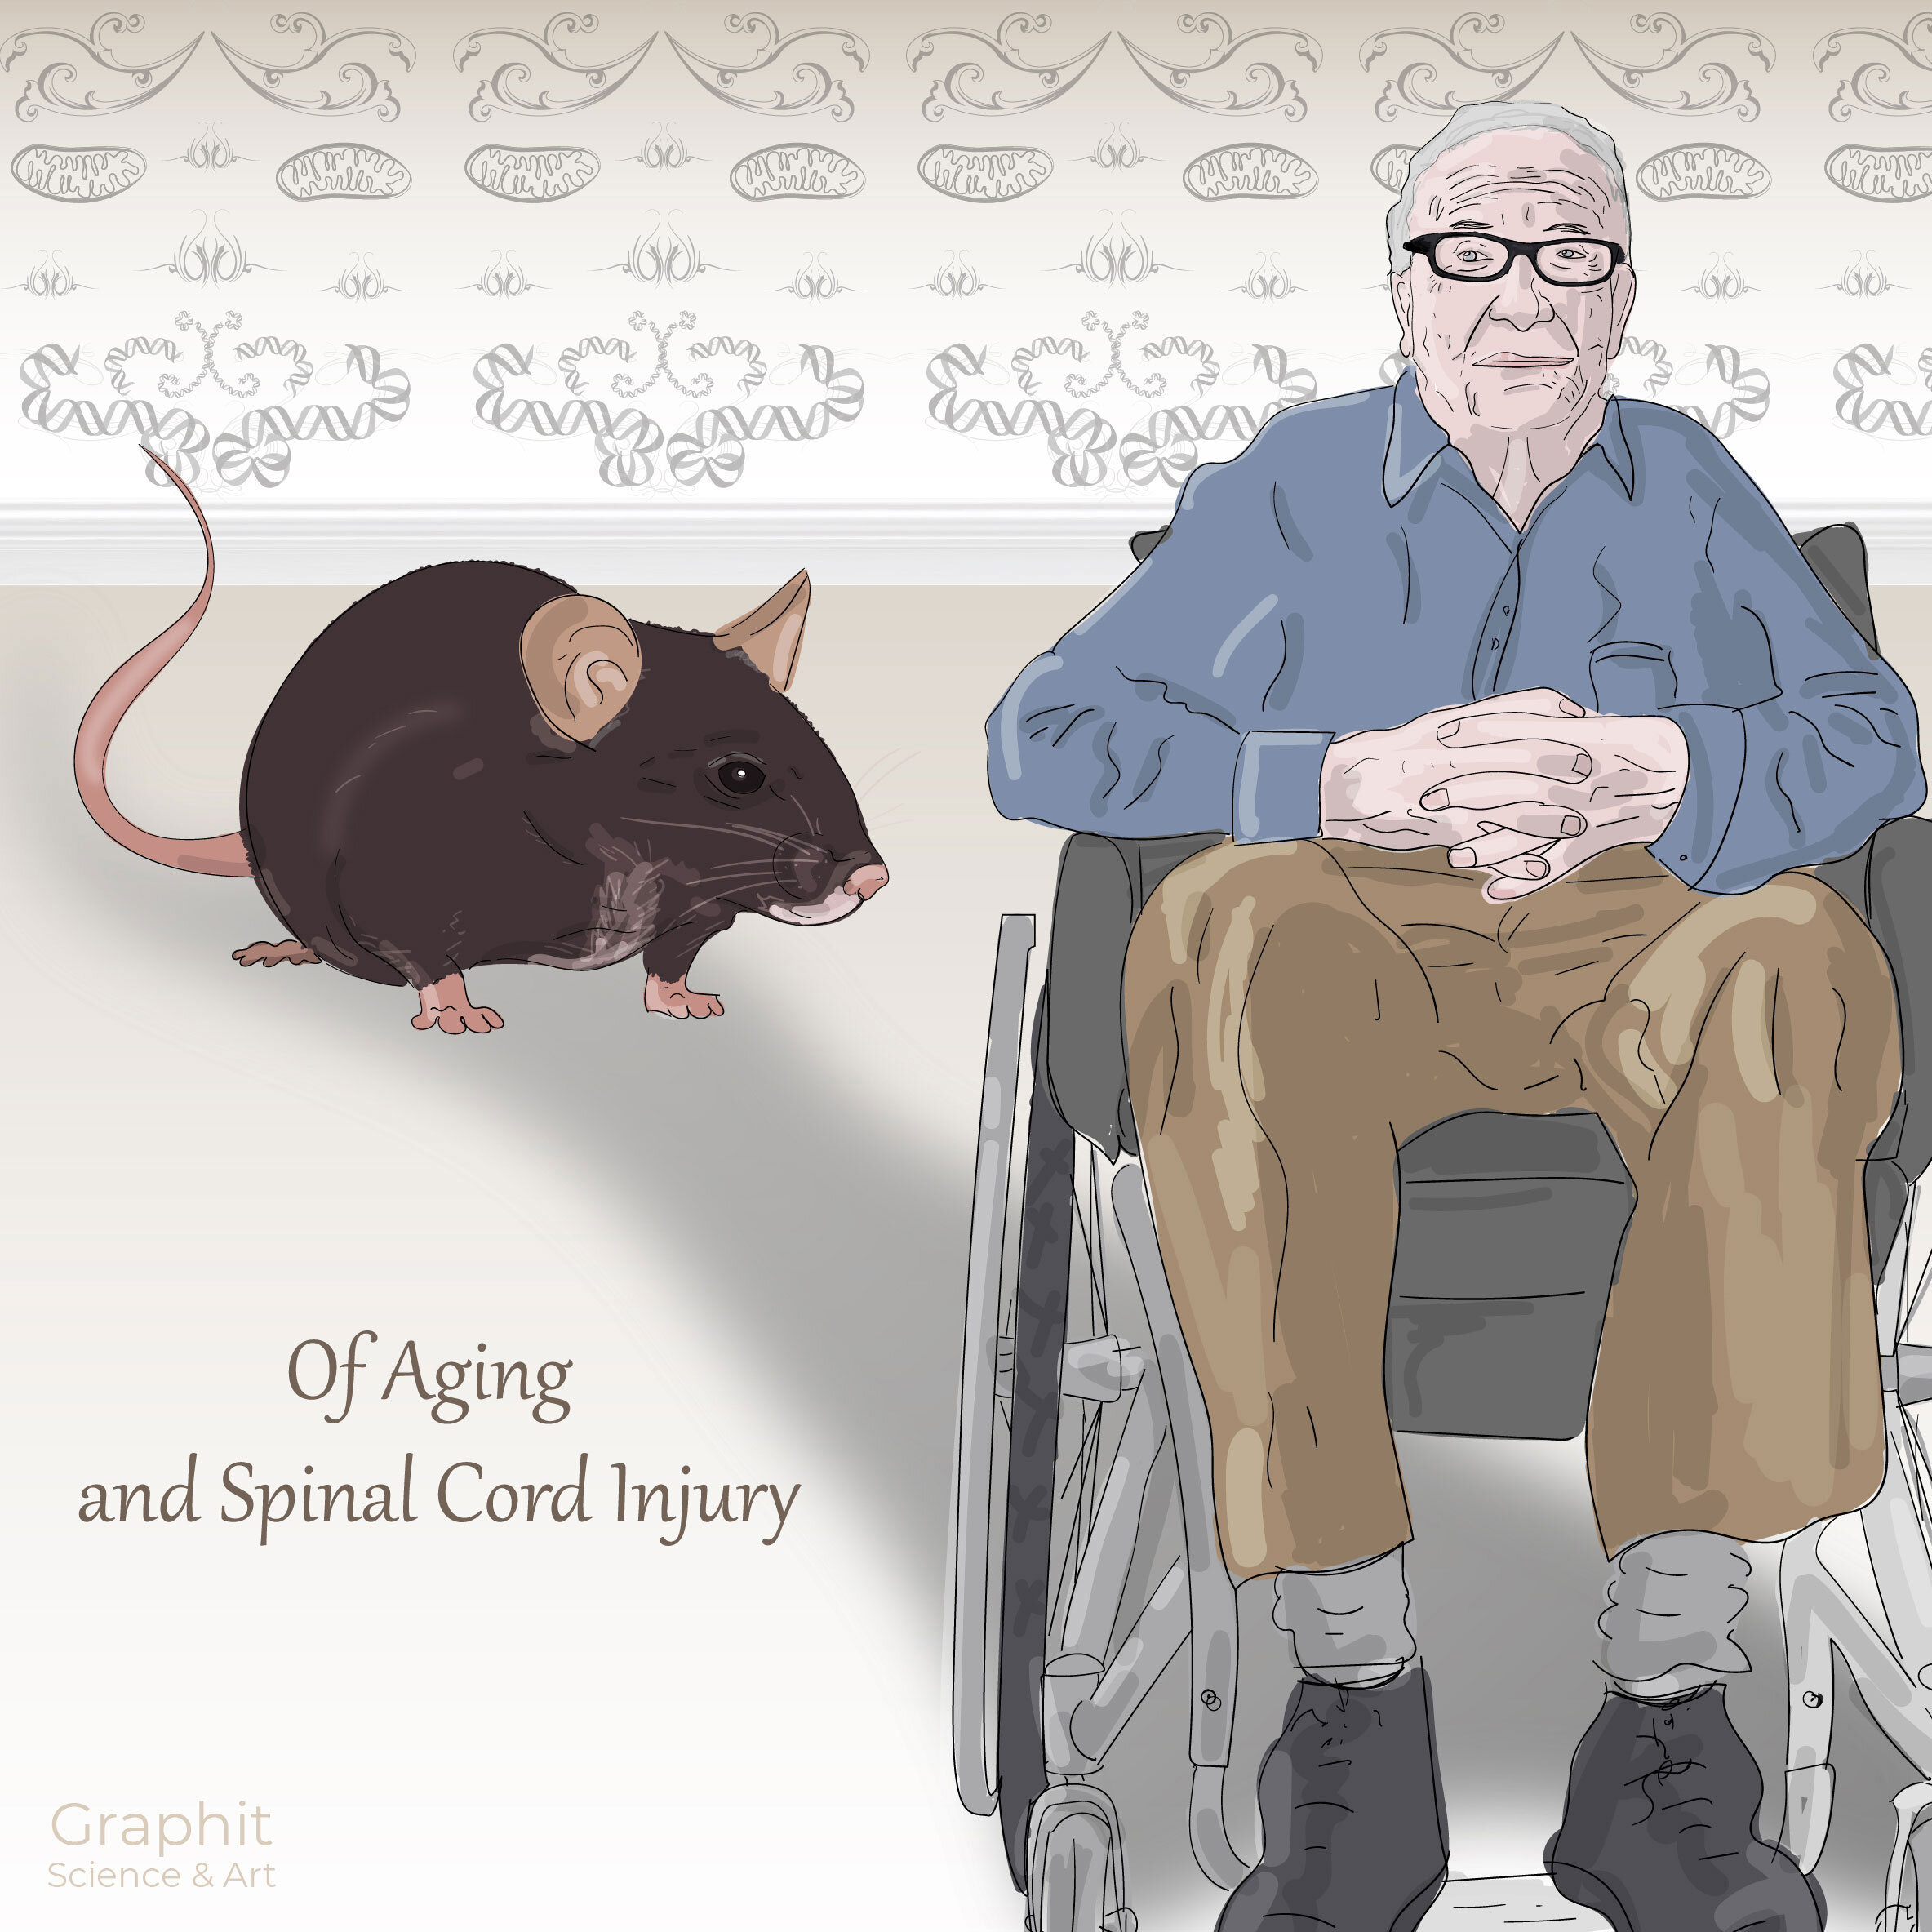
Why Research Matters: A collection of spinal cord research from around the world. “Of Ageing and Spinal Cord Injury” T. C. Sutherland. Spinal Research Institute, 2020 (p.20-21)

Quantification of CpG Motifs in rAAV Genomes: Avoiding the Toll. J. Fraser Wright. Molecular Therapy, 2020, 28(8): 1756–1758


The Influence of Neuron-Extrinsic Factors and Aging on Injury Progression and Axonal Repair in the CNS. T. Sutherland and C. Geoffroy , Front Cell Dev Biol, 2020, 25;8:190


SCI and depression: Does inflammation commandeer the brain? K. Brakel and M. Hook, Experimental Neurology, 2019, 320:112977
Portfolio: Graphical abstracts & Covers / Visual Communication / Logos